
Software code metrics, also known as software quality metrics, have become an indispensable tool for software developers in ensuring the quality, maintainability and testability of their code.
Software metrics can assist development teams in identifying potential problems, areas of complexity and also areas most at risk within the code, before these issues cause failures or foibles during runtime or deployment.
There are a great number of different software metrics, ranging from simple measures of size and complexity – like the number of Lines of Code (LOC) and the number of parameters to a function – through to more complex calculations – like the number of independent paths through a method or function, and OO-specific metrics like Coupling and Cohesion.
Finally, there are metrics derived from academic research work, which purport to provide fairly realiable measures of complexity or testability, like the McCabe Cyclomatic Complexity metric, or the Halstead Complexity Measures.
Static analysis tools are often used to produce software code metrics as a result of the paring and processing that they are already performing.
SciTools Understand is one such static analysis tool capable of producing detailed reports of a vast range of software metrics. helping developers to understand their code better and know which parts need to be reworked or improved.
What Software Metrics does Understand support?
Understand is very efficient at collecting software metrics for the code being analysed.
These metrics can be extracted automatically via command line calls, exported to spreadsheets, displayed graphically, explored dynamically in the GUI or customised via the Understand Perl API.
They can also be output at the project level, for individual files, classes, functions or custom architectures.

Most metrics in Understand can be categorised into the following groups:
- Complexity metrics (e.g. McCabe Cyclomatic Complexity)
- Scope metrics (e.g. Lines of Code)
- Object-oriented (e.g. Coupling between classes)
Understand does not push a particular coding methodology. Understand does not tell you that your code is “good” or “bad”.
Understand only tries to represent the data as flexibly as possible. This allows you to interpret the data as you see fit.
Here is a full list of the metrics that Understand supports and a description of how they are calculated.
Click here for a detailed description of how many of the C++ metrics are implemented.
Using custom metrics in Understand
To use your own metrics with Understand, there is a full Perl API interface to the database and a fully developed plugin mechanism.
For example, there is a sample Perl API script provided with Understand that produces the Halstead Maintainability Index for each file and function in your project.
Cyclomatic complexity (CC) metrics
Cyclomatic Complexity (CC) – also known as McCabe Cyclomatic Complexity or Conditional Complexity – is a measure of complexity relating to the control flow graph of the programunits.
Understand counts the number of linearly independent paths through a module and reports the aggregate, average and sum metrics for the classes and files containing them.
A high CC value indicates that there are too many branching paths within the function, which tends to make the software module more complex to read, more difficult to understand, and more time-consuming to test.
| Cyclomatic Complexity (CC) | Risk Evaluation |
| 1-10 | a simple program, without much risk |
| 11-20 | more complex, moderate risk |
| 21-50 | complex, high risk program |
| 50+ | untestable program (very high risk) |
One might now think that every highly complex program should be rewritten and consider re-factoring.
However, the interconnectedness and potential impact should also be considered.
If a complex program has run successfully for years with minimal problems, one should be very wary of rewriting it just to reduce complexity.
Variations of Cyclomatic Complexity
The McCabe Cyclomatic Complexity metric is defined as the cyclomatic complexity of a structured program with only one input and one output point = the number of decision points contained in that program plus one. Understand gives the cyclomatic metric using the following method:
- For a given function, the keywords for decision points (FOR, WHILE, etc.) are counted and then 1 is added. For a switch statement, each “case” is counted as 1 and the “switch” itself adds 1 to the final cyclomatic complexity value. Understand supports several variants for calculating this metric:
- Modified Cyclomatic Complexity is intended to better reflect the impact on the readability complexity of modules that might have one or more large multi-decision structure statements (switch statements in C/C++) with many decisions (cases in C/C++). In the normal CC metric switch statements generally have a big impact on the metric, because each case would add one. Switch statements like this often occur in state machine systems or process main execute functions, and while they do add significant complexity from a testability perspective, they are usually very simple to read and understand. In fact they are quite a neat solution to such requirements. The Modified CC metric is intended to better align, with this true readability and each case in a switch statement is not counted and instead the entire switch structure counts as just one.
- Strict cyclomatic complexity adds the notion of logical AND and OR operations in conditional expressions adding a further 1 to the complexity for each of their occurrences. This metric ties in nicely then with boolean coverage for testing purposes, as is often required by the higher safety-critical systems.
Other complexity metrics
Understand also calculates many other complexity metrics, including Depth of Inheritance Tree (DIT), Nesting levels, Knots, and Halstead Complexity (via plugin).
Metrics can be viewed directly in Understand via the Metrics Browser.
Additionally, you can export metrics to a spreadsheet.
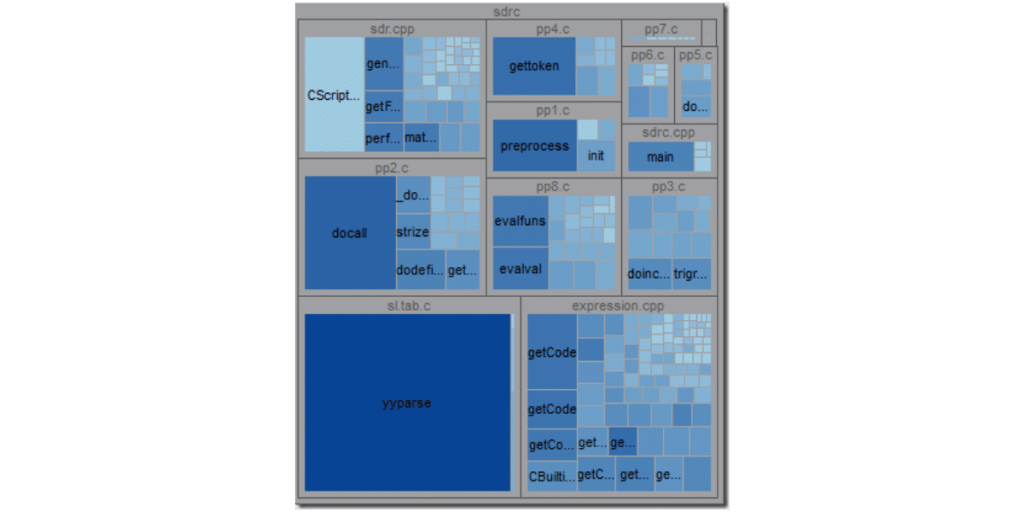
The metrics treemap provides another way to view metrics using size and colour.
Conclusion
In conclusion, the use of software metrics provides tremendous value to software developers across a whole manner of different disciplines and tasks.
The metrics included in Understand have evolved over many years to meet the more common and important customer requirements.
However, we know that you may need something different.
To help you develop your own metrics, there is a full API interface to the Understand database and a fully developed plugin mechanism.
If you have any questions, our support team will be happy to assist you: [email protected]
Text sources:
https://support.scitools.com/support/solutions/articles/70000582289-metrics-overview
https://support.scitools.com/support/solutions/articles/70000582299-cyclomatic-complexity
https://scitools.freshdesk.com/support/solutions/articles/70000582300-source-lines-of-code